India has officially become the 4th largest economy in the world in terms of nominal GDP, overtaking countries like the UK and France. While this is a significant milestone, understanding the India 4th largest economy status requires a deeper analysis—especially when viewed through the lens of per capita income. In this article, we explore the real picture behind India’s economic ranking, its GDP performance, and how average income levels paint a more realistic socioeconomic scenario.
India 4th Largest Economy: GDP Milestone
India’s nominal GDP has crossed $3.9 trillion, making it the India 4th largest economy globally after the US, China, and Japan. This ranking is based on total national output measured in US dollars, reflecting the scale of India’s economy as a whole. The growth has been driven by robust sectors such as IT, pharmaceuticals, manufacturing, and a strong domestic market.
However, the India 4th largest economy tag does not necessarily indicate a high standard of living for its citizens. For a clearer understanding, one must look at per capita income.
Top 10 Largest Economies In the World 2025
India is predicted to become the third-largest economy by FY28
| Country | Nominal GDP (USD Billion) | Estimated GDP Growth Rate (2025) |
|---|---|---|
| United States | 30,507.22 | 2.1% |
| China | 19,231.71 | 4.8% |
| Germany | 4,744.80 | 1.2% |
| India | 4,187.02 | 6.8% |
| Japan | 4,186.43 | 1.0% |
| United Kingdom | 3,839.18 | 1.4% |
| France | 3,211.29 | 1.3% |
| Italy | 2,422.86 | 0.9% |
| Canada | 2,225.34 | 1.6% |
| Brazil | 2,125.96 | 2.2% |
Per Capita Income: The Ground Reality
While India ranks high in overall GDP, its per capita income tells a different story. As of 2025, India’s per capita income is estimated to be around $2,700 annually, placing it much lower in the global rankings. This means that despite being the India 4th largest economy, the average citizen earns significantly less compared to those in developed nations.
For comparison:
| Country | Nominal GDP Rank | Per Capita Income (approx.) |
|---|---|---|
| United States | 1st | $85,000 |
| Japan | 3rd | $40,000 |
| India | 4th | $2,700 230454.59rupees |
| Germany | 5th | $52,000 |
The India 4th largest economy designation reflects national output, but the income distribution and purchasing power at the individual level remain relatively low.
india 1 doctor for 1000people , japan 2.6 for 1000 people.
hopsital to bed ratio india 1.6 /1000 japan 12.7/1000
Human development index india 0.644 rank 134/194 japan 0.925 rank 23rd
india’s unoranized sector contributes 45% of GDP,
GDP to PPP india can purachse with 1 dollar more than japan.
GDP (PPP) means gross domestic product based on purchasing power parity.
GDP per capita 140th out of 199
Income inequality k shaped growth
GDP per capita wiht 5% wealthy people $2,700
GDP per capita wiht -5% wealthy people $1,100
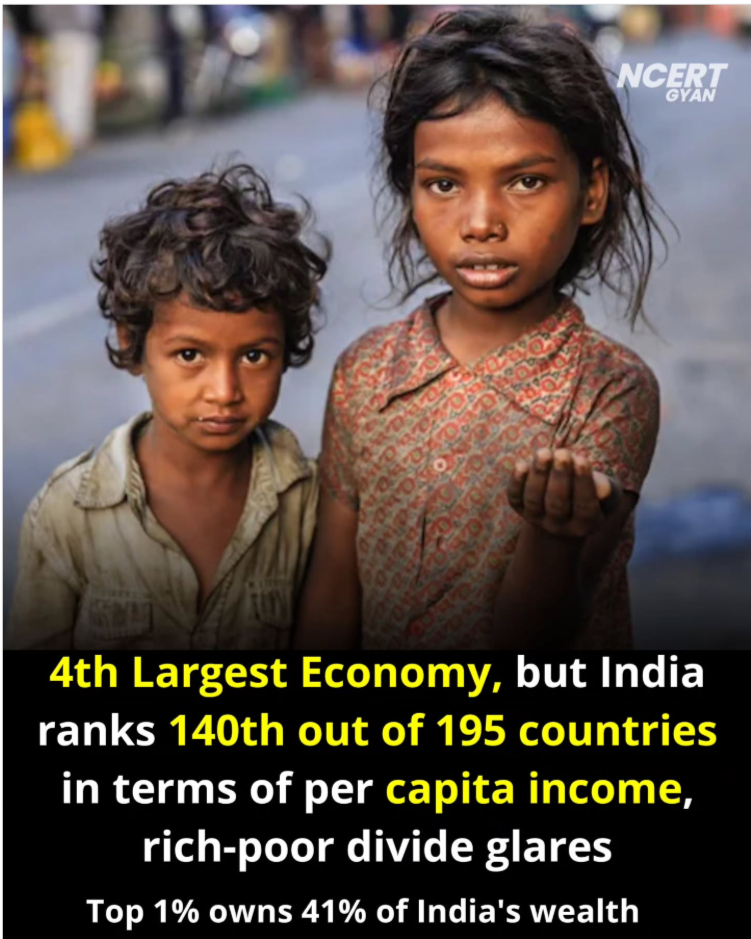
1% Individuals own more than 40% wealth india -oxfam
50% people owns only 3% wealth of india.
Indieqlity adjusted HDI india 0.47 vs 0.87 japan
make in india failed
10 crore manufacturing jobs not achived but 5.4M jobs lost in manufactureing
2017-2025 6Million employement in Agriculture.
50% GDP by service sector
MSME helped vietnam but india MSME stopeed may be due to GST filing like entry barrier,& maintanence.
India rank by per capita income
In terms of market exchange rates, India’s rank in per capita GDP in 2024 was 144th among 196 countries. Even in terms of PPP international dollars, India’s rank in per capita GDP in 2024 was 127th among 196 countries.
| Global Rank | Country | Per Capita Income (USD) |
|---|---|---|
| 1 | Luxembourg | $154,910 |
| 2 | Singapore | $153,610 |
| 3 | Macao SAR | $140,250 |
| 4 | Ireland | $131,550 |
| 5 | Qatar | $118,760 |
| 6 | Norway | $106,540 |
| 7 | Switzerland | $98,140 |
| 8 | Brunei Darussalam | $95,040 |
| 9 | Guyana | $91,380 |
| 10 | United States | $89,680 |
| 11 | United Arab Emirates | $85,000 |
| 12 | Denmark | $84,000 |
| 13 | Netherlands | $82,000 |
| 14 | Australia | $79,000 |
| 15 | Germany | $76,000 |
| 16 | Canada | $74,000 |
| 17 | Sweden | $72,000 |
| 18 | Austria | $70,000 |
| 19 | Finland | $68,000 |
| 20 | United Kingdom | $66,000 |
| … | … | … |
| 141 | India | $2,940 |
📊 Comparative Wealth Distribution Metrics (2025)
| Country | Gini Coefficient | Top 1% Wealth Share | Median Wealth per Adult (USD) | Mean Wealth per Adult (USD) |
|---|---|---|---|---|
| India | 0.82 | 40.1% | $3,000 | $16,000 |
| China | 0.70 | 30% | $25,000 | $67,000 |
| United States | 0.85 | 35% | $93,271 | $560,000 |
| Pakistan | 0.65 | 25% | $1,500 | $5,000 |
| Germany | 0.60 | 25% | $85,000 | $250,000 |
| Australia | 0.58 | 20% | $261,805 | $546,184 |
Note: Gini Coefficient values range from 0 (perfect equality) to 1 (maximum inequality).
🇮🇳 India’s Wealth Distribution Overview
India’s Gini coefficient of 0.82 indicates a high level of wealth inequality. The top 1% of the population controls approximately 40.1% of the nation’s wealth, while the bottom 50% holds a significantly smaller share. This disparity highlights the concentration of wealth among a small segment of the population.
🇨🇳 China’s Wealth Distribution Overview
China’s Gini coefficient stands at 0.70, reflecting substantial wealth inequality, though less pronounced than India’s. The top 1% owns about 30% of the country’s wealth. China’s economic policies have aimed at reducing inequality, but challenges persist.
🇺🇸 United States Wealth Distribution Overview
The United States exhibits a Gini coefficient of 0.85, indicating significant wealth inequality. The top 1% holds approximately 35% of the nation’s wealth. Despite a high median wealth per adult, the disparity between the wealthy and the rest remains substantial.
🇵🇰 Pakistan’s Wealth Distribution Overview
Pakistan’s Gini coefficient is 0.65, suggesting moderate wealth inequality. The top 1% controls around 25% of the nation’s wealth. Both median and mean wealth per adult are relatively low, reflecting broader economic challenges.
🌍 Global Context
In comparison to other top economies:
-
Germany: With a Gini coefficient of 0.60, Germany maintains a more equitable wealth distribution.
-
Australia: Australia’s Gini coefficient of 0.58 indicates relatively low wealth inequality, supported by social policies and wealth redistribution mechanisms.
📌 Key Takeaways
-
India: High wealth inequality with a significant concentration of wealth among the top 1%.
-
China: Moderate to high inequality, though less severe than India’s.
-
United States: High inequality, with substantial wealth held by the top percentile.
-
Pakistan: Moderate inequality, but overall lower wealth levels.
-
Germany and Australia: Lower levels of wealth inequality, reflecting effective redistribution policies.
when will india become 3rd largest economy
India is predicted to become the third-largest economy by FY28
Purchasing Power Parity vs. Nominal GDP
Another angle to examine the India 4th largest economy claim is through Purchasing Power Parity (PPP), which adjusts GDP for cost of living. By this measure, India is already the 3rd largest economy, trailing only China and the US. However, even with PPP adjustments, the per capita income remains far behind, showing that wealth is concentrated and unevenly distributed.
Thus, while the India 4th largest economy based on GDP is factually correct, the individual economic well-being is not reflected proportionally.
Challenges Behind the Growth Numbers
India’s large population, though a strength in terms of labor force and consumption, also dilutes its per capita earnings. Key challenges include:
-
High income inequality
-
Unemployment and underemployment
-
Rural-urban development gap
-
Low human development indicators
These challenges indicate that being the India 4th largest economy does not automatically translate to improved living standards unless inclusive growth is ensured.
The Way Forward for India
To align its per capita income with its global economic standing, India must:
-
Invest in quality education and healthcare
-
Expand formal employment opportunities
-
Strengthen infrastructure in rural areas
-
Encourage MSMEs and entrepreneurship
A focused approach will help ensure that the benefits of being the India 4th largest economy reach every section of society.
FAQs on India 4th Largest Economy
Q1. Is India really the 4th largest economy in the world?
Yes, in terms of nominal GDP, India is now the India 4th largest economy globally, surpassing major European economies.
Q2. Why is India’s per capita income so low despite a high GDP?
India’s large population divides the GDP among more people, resulting in a lower per capita income, even though it is the India 4th largest economy.
Q3. What is India’s rank in per capita income globally?
India ranks well below the top 100 countries in terms of per capita income, despite being the India 4th largest economy.
Q4. How does PPP affect India’s economic ranking?
Under Purchasing Power Parity, India ranks as the third-largest economy, but this still doesn’t significantly raise its per capita income rank.
Q5. What can improve per capita income in India?
Improving education, job creation, rural development, and income equality can help India raise its per capita earnings, reflecting its India 4th largest economy status more effectively.
